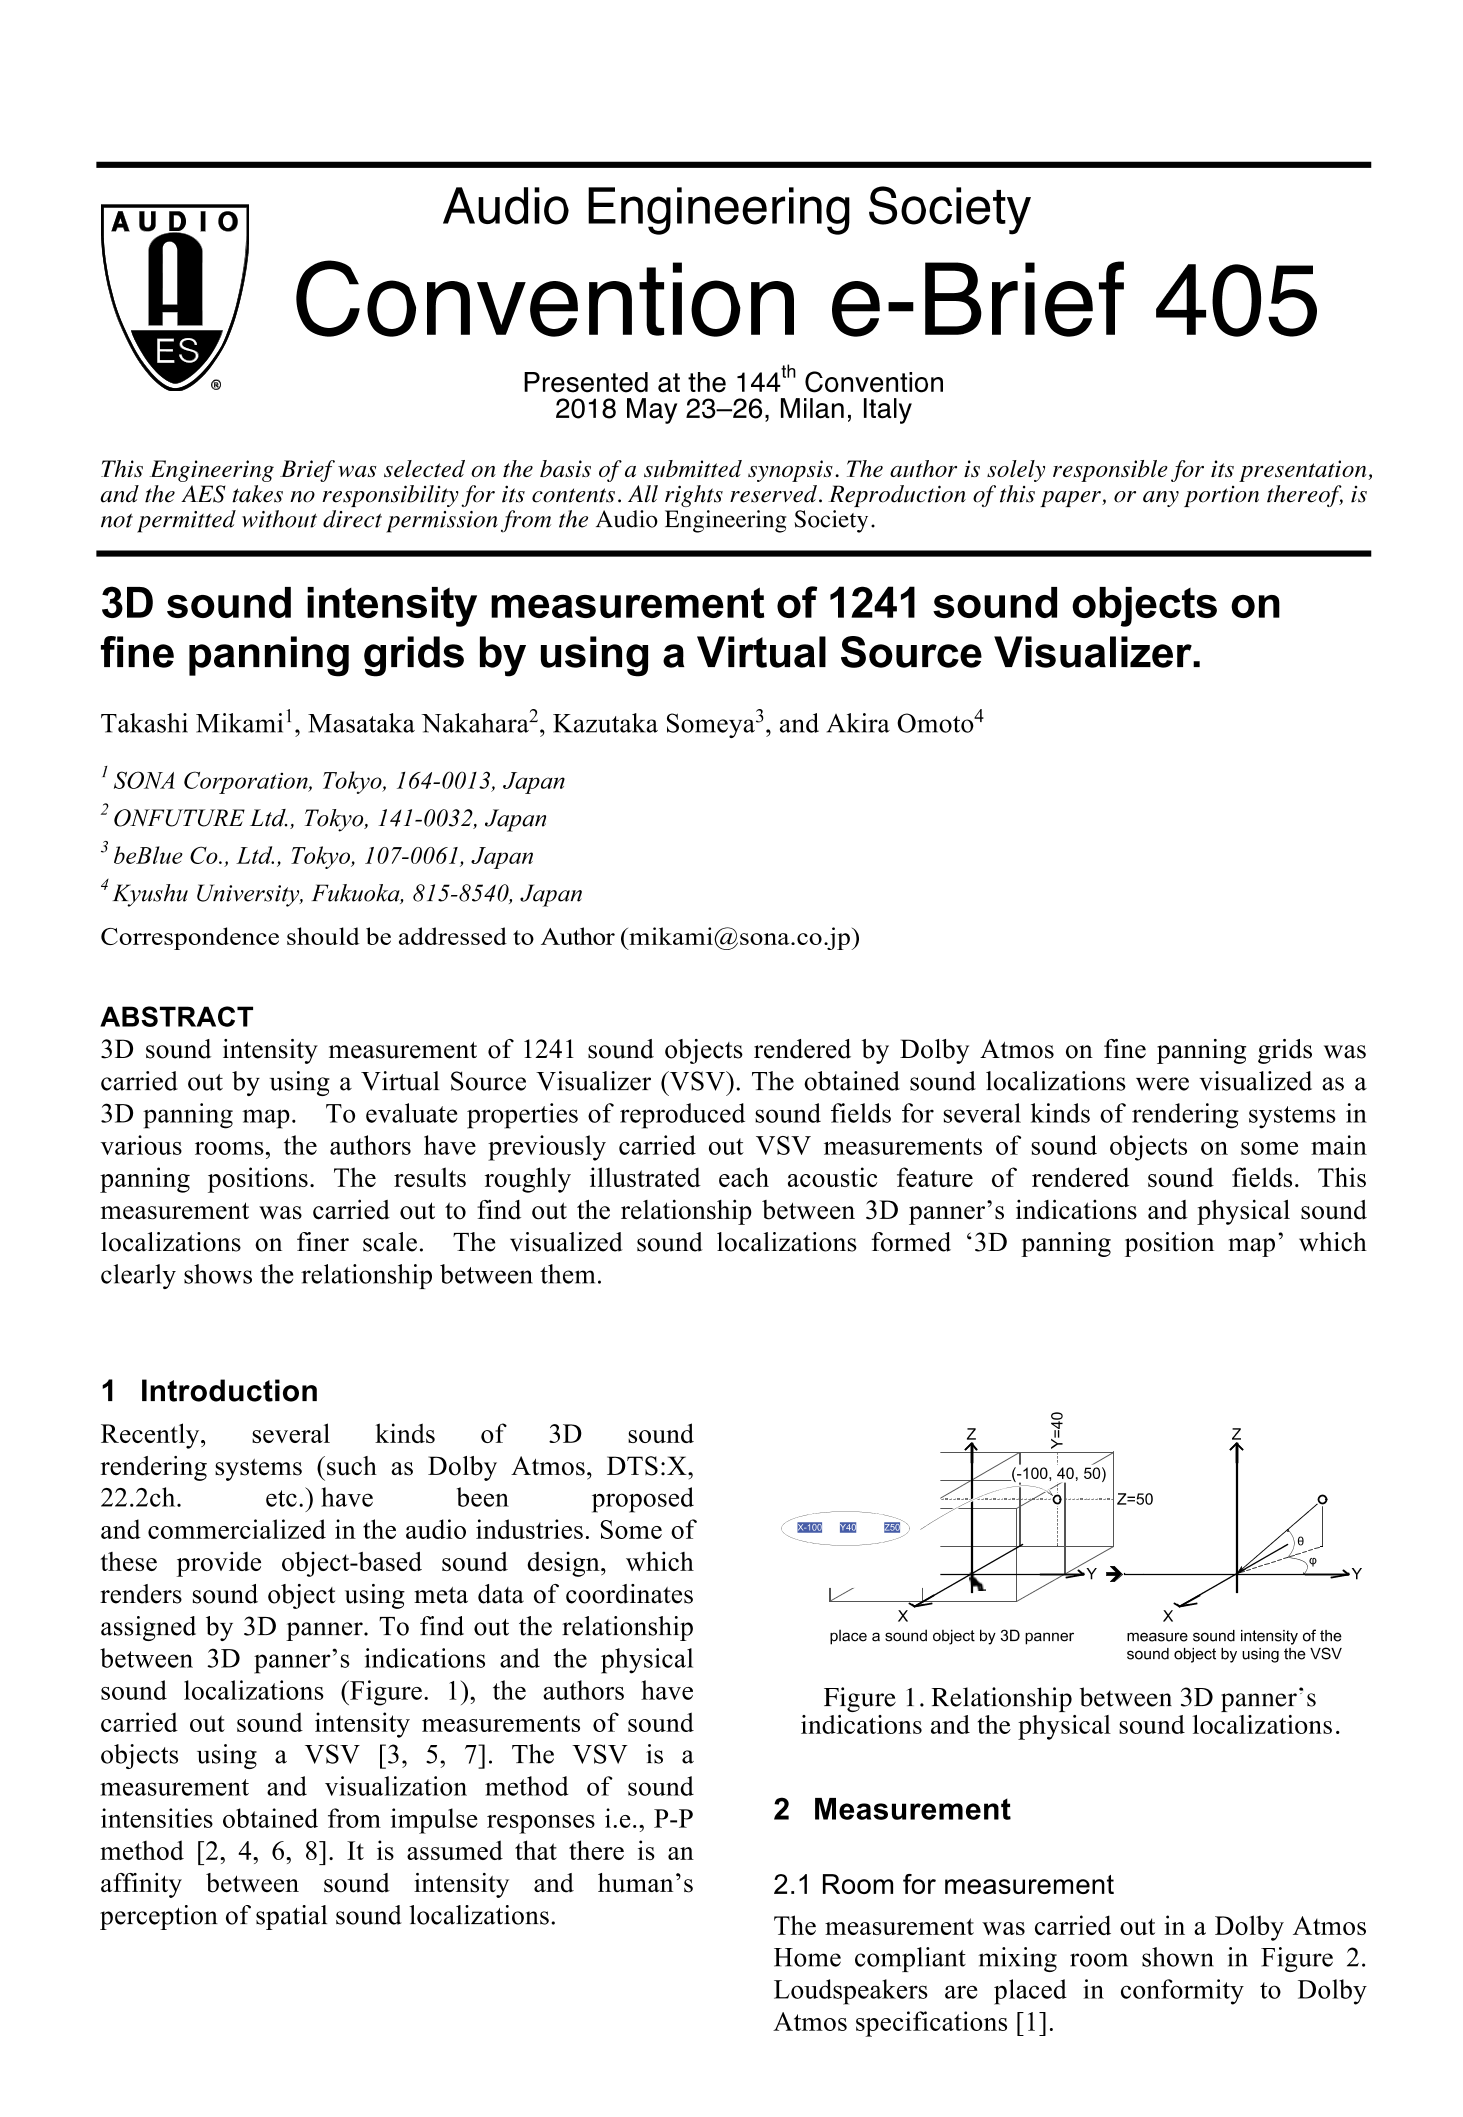
3D sound intensity measurement of 1241 sound objects rendered by Dolby Atmos on fine panning grids was carried out by using a Virtual Source Visualizer (VSV). The obtained sound localizations were visualized as a 3D panning map. To evaluate properties of reproduced sound fields for several kinds of rendering systems in various rooms, the authors have previously carried out VSV measurements of sound objects on some main panning positions. The results roughly illustrated each acoustic feature of rendered sound fields. This measurement was carried out to find out the relationship between 3D panner’s indications and physical sound localizations on finer scale. The visualized sound localizations formed “3D panning position map” that clearly shows the relationship between them.
https://www.aes.org/e-lib/browse.cfm?elib=19518
Click to purchase paper as a non-member or login as an AES member. If your company or school subscribes to the E-Library then switch to the institutional version. If you are not an AES member and would like to subscribe to the E-Library then Join the AES!
This paper costs $33 for non-members and is free for AES members and E-Library subscribers.
Learn more about the AES E-Library
The Engineering Briefs at this Convention were selected on the basis of a submitted synopsis, ensuring that they are of interest to AES members, and are not overly commercial. These briefs have been reproduced from the authors' advance manuscripts, without editing, corrections, or consideration by the Review Board. The AES takes no responsibility for their contents. Paper copies are not available, but any member can freely access these briefs. Members are encouraged to provide comments that enhance their usefulness.
Start a discussion about this paper!